

Finally made it back from the other side
Also building and launching payments dashboards

Welcome to Payments Culture!
This newsletter explores how money moves, around the world — and why it matters.
I’ve set up a reader survey for this newsletter.
It takes a maximum of 4 minutes to complete, and your feedback really helps me understand what is and isn’t working. One respondent, selected at random, will receive a $100 gift card. Thanks for your support with this.
You can contact me on LinkedIn, Twitter (X), via email, and with the below button.
I’m always interested in feedback, comments, collaboration opportunities, or perhaps you want to sponsor this newsletter?

I didn’t write on this Substack during March at all. This wasn’t my intention. And thanks for bearing with me during this time! There was a good reason for this.
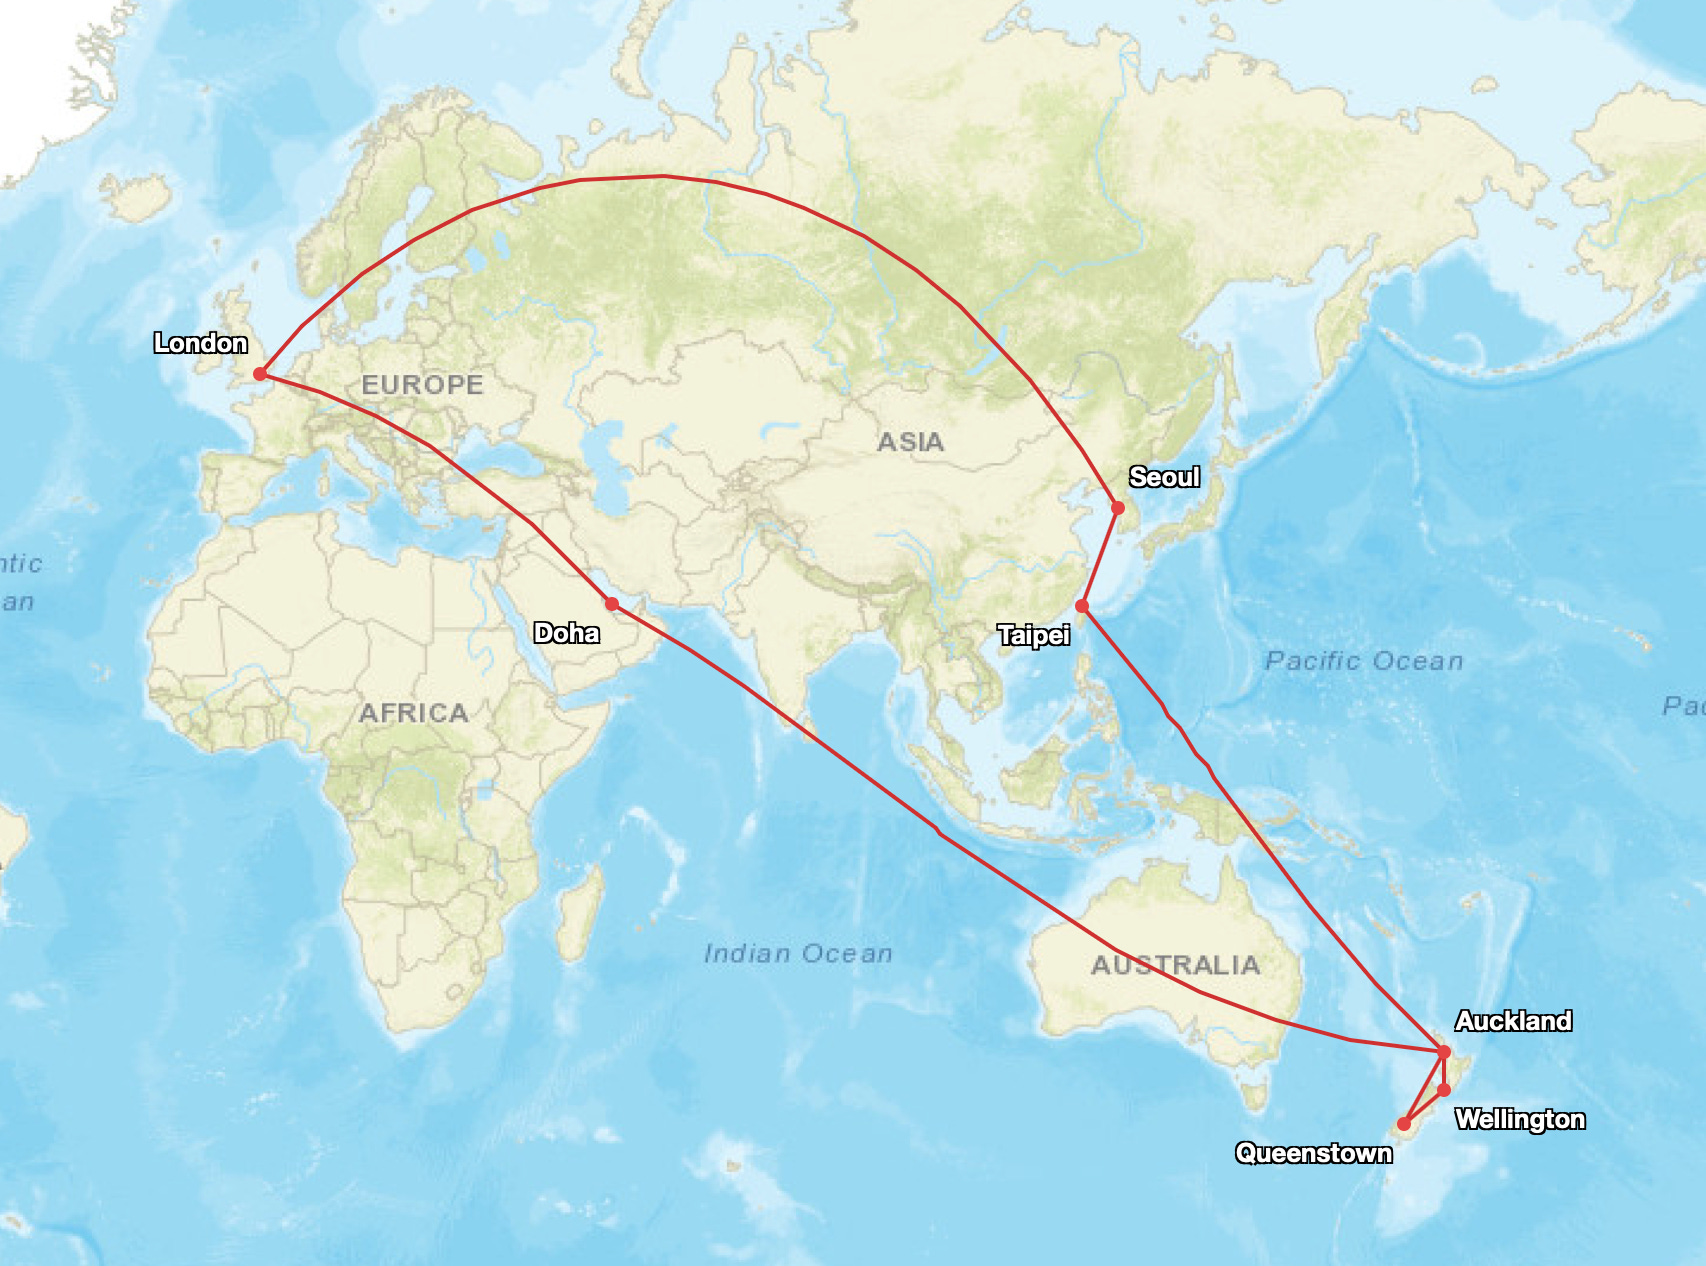
I left London for Auckland on the 24th of February.
In New Zealand as well as spending time in Auckland I also visited Queenstown and Wellington. My flight back to London was on the 12th of March.
But I finally got back to London on the 1st of April.
My actual journey ended up like this:
Why did my journey get so much longer in terms of time and distance?
Quite simply, my flight back to London was cancelled due to the Iran war.
All flights going via the Middle East were stopped for a couple of weeks, and many routes have still not opened, or if they have, they are flying with a high risk of cancellation or last minute changes.
The airline I had booked my flight with informed me a couple of days before my return date that my flight was cancelled. To be honest, the writing had been on the wall. I’d watched the war kick-off during my first days in New Zealand and it was pretty clear that flight disruptions to the Middle East were not going to end anytime soon.
But expecting a flight cancellation and getting the official confirmation are two different things. When you get the confirmation then reality hits you: so how am I going to get home exactly?
In the first instance, you get an offer via email — the ability to rebook onto a new flight on the same airline, the same route, up to two weeks later. But I’d been following the situation closely, and I didn’t expect things to settle down within two weeks. So unless the airline was going to pay for my accommodation for me to wait around to see if the flight happened within those two weeks or not then this felt like a risk.
Unsure of the next step. I had to call the airline’s customer service line and discuss.
In order to speak to the airline, I had to wait until 10pm New Zealand time — the customer service number didn’t operate until 9am UK time (not very handy for a supposedly global airline). With this 13-hour time difference, I ended up waiting on hold for an hour, and finally spoke to someone after 11pm local time.
It would be easy to think that airlines can’t really help in such a situation — I mean there was a war going on. I get that. But under UK law airlines have certain obligations when a journey starts in the UK. Of course, the precise nature of these obligations will be contested in an unusual situation such as during wartime. Many companies claim force majeure during war, and this nullifies their contractual obligations entirely.
However, for airlines, the responsibilities remain. That said, they give me zero help in getting home. I mean really zero. No option to re-route via other airlines, and if I stuck around in New Zealand for a couple of weeks then the chance of getting accommodation costs covered seemed slim.
I decided the only option was to find my own route back and complain to the airline later. Although, as you can imagine this wasn’t an easy task. Many British travellers that visit Australia, New Zealand, places in Asia, and even destinations in Africa often fly via Dubai, Qatar or Abu Dhabi. The Middle East has become a key transit hub for British travellers. In this scenario it meant many people were stranded, and quickly the alternative flight options disappeared.
I spent a couple of evenings awake until 3 a.m. in my Airbnb in Wellington, where I was attending a close family wedding. I was searching flights on Google Flights trying to figure out alternative routes back to London. Unless I wanted to pay £3,500 for a one way economy ticket from Kuala Lumpur to London in ten days time (this was literally the only availability I could find in mid-March), it felt like the best option was to wait things out for a couple of weeks.


With a combination of airmiles I’d accumulated over the years, a desire to travel somewhere new, and helped by the fact I didn’t need to be back in the UK with any urgency, I decided to spend a bit longer in New Zealand before flying to Taipei, and eventually flying back to London from Seoul on April 1st. My trip was extended by 20 days.
It turned out to be a solo travel experience that I thought had long passed me by. Overall I had a great time, and it’s given me plenty to write about in the weeks ahead.
Building with Claude Code
In my last post I wrote about building with AI and how some fintech startups are moving much faster with AI. Through my own experimentation and building I’ve got to experience this in a limited way first hand, and while I didn’t publish anything on this Substack while I was traveling, I did launch two payments dashboards — I’ll explain more about these shortly.
Firstly, for someone who is not technical (eg. me), using Claude Code has been a revelation. Until the start of this year I had stayed away from what has become known as vibe coding, or coding via prompting, chatting to an AI model and giving it instructions, rather than writing code directly. Yet after Christmas I started with Claude Code and never looked back.
My first encounters were somewhat mundane and unrelated to professional matters. One project was building an app to help track the first 100 days in the life of a new puppy. I was surprised at the results and quickly got thinking how I could build payments some payments-related projects.
I built a crypto wallet. I never made this public, and don’t intend to as if I put the solution public then there will be regulatory aspects to consider. Additionally the app doesn’t have any particular USP compared to other options on the market, and ultimately with crypto projects there’s a need to raise funds for marketing an other aspects. It’s not a good use case for a one man project. Despite this, I learned a lot as building it was a great experience in learning how the various building blocks fit together when building a wallet application.
The app I built includes:
A USDC1 stablecoin wallet built on Base2 that lets anyone send and receive money globally for under $0.01 per transaction.
Users never need to manage private keys or pay gas fees.
Dynamic handles authentication and wallet creation, so users can sign up with email or social login and get a wallet instantly
It offers the ability to create shareable payment request links that can be shared via WhatsApp, Telegram, or SMS.
Anyone with a USDC wallet (Coinbase, MetaMask, etc.) can pay a request link instantly at near-zero cost.
For people who don’t have USDC yet, there are fiat on-ramps via card, bank transfer, Apple Pay, Google Pay, PIX, PayPal, and Revolut Pay.
You can deposit any idle USDC balance into Aave or Moonwell to earn yield directly in app.
The app supports 12 languages and auto-detects your region to show the most relevant payment methods first
While this app sits as a perpetual work in progress I moved onto working on projects that could have wider use and relevance. These two projects were driven by a simple realisation that often the data I wanted — in order to learn more about a topic and to write about it on this Substack — was often really hard to find. When it was available it might not be easy to export or visualise. Could I make something better for my own benefit and for the benefit of others also?
Stablecoin Dashboard
Provided an API exists then with Claude Code you can pull data into a chart, a website, or build an app. I remember looking for data about stablecoins last summer and struggling to find data I wanted in a format I liked. With this in mind I started to build out a stablecoin dashboard.
The dashboard is live here: https://stablecoindashboard.net
The result is useful and accessible data on the stablecoin market. You can see information such as stablecoin circulation value (sometimes referred to as market cap) by each of the top 100 USD-pegged stablecoins, and you can choose from custom or a preset date range. The main dataset can be download as a CSV file or a PNG image file. Additionally there’s information such as the top non-USD pegged coins, net issuance charts per coin, and details of what blockchain(s) each coin uses.3
Most of the data updates daily at 00.00 UTC, however the peg watch function is real-time, and tracks how close the two largest stablecoins stay to $1.00. Maximum deviations from the peg by time period provides a historical view of just how stable USDT and USDC have actually been.

There’s a weekly and monthly analysis function which updates at a set time each week/month and is based on the various data on the dashboard at a certain point in time. This gives a useful text summary and analysis which can be easily shared online.
The weekly analysis is posted on this Substack.
With this project I was impressed at how well Claude Code analysed various APIs and suggested which would be best based on my requirements. I kept prompting to get the UI that I wanted. It may sound effortless but in reality it takes many hours of back and forth to get anything worthwhile to develop. Then the iteration begins. More consideration of what could be useful, more gradual additions of data and improvements to the interface. The goal with stablecoin dashboard is to add transaction information to sit alongside the circulation data.
Real-Time Payments Dashboard
Several times when writing this Substack I’ve wanted to get information on real-time payment systems.4 By how much did India’s UPI increase year-on-year? What was the volume of Pix transactions in 2025? In the UK, what share of card payment transactions is Faster Payments? Usually to get the answers to these questions you’d need to go to the website for each payment system, their regulator, or another official body and look up the data — often a very manual process. I couldn’t find any source showing all of real-time payment systems in one place. So this is what I decided to develop.
The dashboard is live here: https://rtpdashboard.net
There’s data available for 32 payment systems. Some go back two years and some go back much longer. You’ll notice that some systems only have annual data, whereas others have monthly data. Wherever possible I’m trying to add additional data but I am hamstrung by what actually exists and is published online
To give you an example, here’s the different types of data that different payment systems publicly offer:
Pix (Brazil) — The Brazilian Central Bank (BCB) has an open data portal with near-real-time stats. The Pix API publishes monthly data, however the BCB also offers daily data on their portal, which makes Pix by far the best data source out of all the 32 systems.
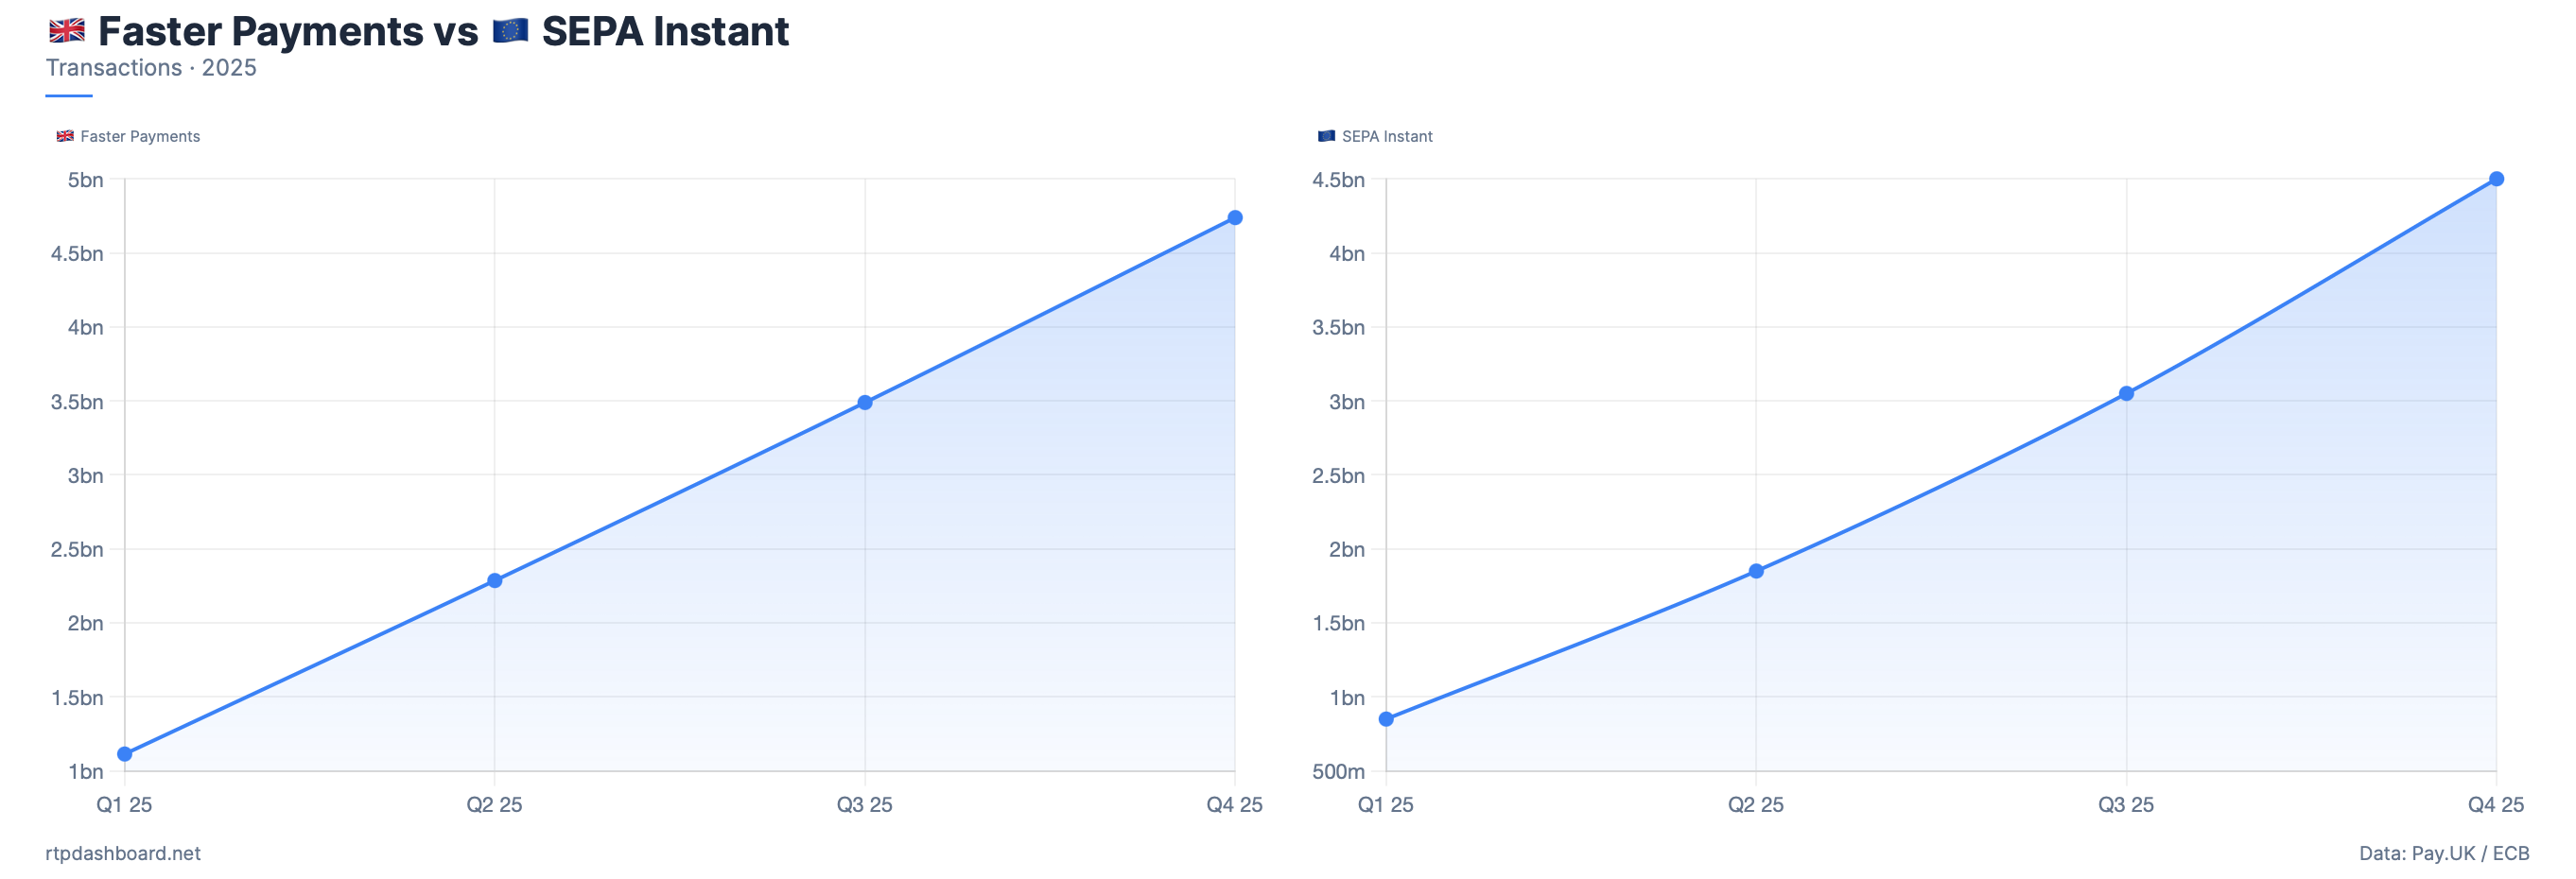
Faster Payments (UK) — Pay.UK publishes monthly data but only as PDF files, and there is no live API.
FedNow / RTP (US) — Both publish quarterly data through the Federal Reserve and The Clearing House respectively. No real-time API.
PromptPay (Thailand) — The Bank of Thailand has a portal where data can be download in a CSV format, which is better than most systems, but no live API yet.
UPI (India) — NPCI publishes monthly data on their website but it’s JavaScript-rendered, not an easily readable API.
Zengin (Japan) — Zengin-Net publishes monthly PDFs going back many years, but each month is a separate PDF file that needs manual parsing.
It's somewhat ironic that so many advanced payment systems can't even offer basic monthly statistics. The world moved to APIs. But the data offered by regulators and other bodies that manage these systems, largely, did not.
As well as being able to see charts and compare various systems, the dashboard has a table view showing all systems side-by-side. You can compare volume, value, and other key metrics for 2024 and 2025 all in one place. As monthly data isn’t easily available for most systems updates will follow quarterly or even annually in some cases. However, I will try to close more data gaps whenever possible.
Let me know any feedback or comments on these dashboards when you get chance to use them. I’ll be adding their links to future posts on this Substack too.
Thanks for reading Payments Culture. I appreciate it!
Please consider sharing this newsletter with a friend or colleague if you enjoyed reading this edition. If you are not yet subscriber please sign up below for a free or paid subscription.
Note that views expressed on this Substack are my own and do not represent any other organisation. Also nothing I say should be taken as investment advice.
USDC is the world’s second largest stablecoin and the one mainly used by fintech companies in their wallet offerings.
Base is Coinbase’s Layer 2 network built on Ethereum, offering fast transactions at a fraction of the cost of transacting directly on Ethereal.
Some stablecoins use more than one blockchain. Some even operate across many blockchains.
Real-time payment systems are those in which transactions sent from one account appear in the recipient’s account almost instantly — within 10 seconds is the rule for Europe’s SEPA instant payments. Additionally real-time payments are 24/7 and not limited to banking hours, which was the case with many legacy payment systems that operated in batches with settlement every 2/3 days such as BACS in the UK.
Loved the two dashboards. On RTP, this surprised me:
ATV seemed to be trending up in many countries whereby I would have expected to trend downwards with more retail adoption of long tail-merchants and more everyday usage. (Perhaps B2B adoption is faster).
Hi Matt, Any views on Western Union's stablecoin project - U.S. Dollar Payment Token (USDPT).